Tip
All input files can be downloaded: Files.
tddft
This keyword defines how to perform time-dependent DFT (TDDFT) calculation.
Options
- type
Value
TDDFTStandard TDDFT.TDATDDFT with Tamm-Dancoff approximation (TDA).RTDDFTRestricted TDDFT.UTDDFTUnrestricted TDDFT.XTDDFTSpin-adaptive TDDFT.RTDARestricted TDA.UTDAUnrestricted TDA.XTDASpin-adaptive TDA.Default
TDDFTThe type of TDDFT calculations. TDA is an approximate case of TDDFT. For closed-shell systems,
RTDDFTandRTDAare the best choices. For closed- and open-shell systems,UTDDFTandUTDAare available. For open-shell systems,XTDDFTandXTDAare also available. IfTDDFTorTDAis used, a suitable method will be automatically selected.
- spin_flip
Value
NoneNo spin flipping is performed.UpFlip beta electrons to alpha ones.DownFlip alpha electrons to beta ones.Default
NoneSpin flipping way for the excited states.
- num_states
Value
An integer.
Default
5The number of excited states to be calculated.
- max_it
Value
An integer.
Default
100The maximum number of Davidson iterations for the TDDFT calculation. If TDDFT fails to converge, you can try to increase this number.
- dim_trials
Value
An integer.
Default
50The maximum dimension of trial vectors. If TDDFT fails to converge, you can try to increase this number.
- energy_cov
Value
A real number.
Default
1.E-7The energy convergence threshold for the TDDFT calculation.
- vec_cov
Value
A real number.
Default
1.E-5The excited state vector convergence threshold for the TDDFT calculation.
- precondition_threshold
Value
A real number.
Default
1.E-8The precondition convergence threshold for the TDDFT calculation.
- print_coeff_threshold
Value
A real number.
Default
0.01Print the excited state coefficients when the absolute value is larger than this threshold.
- transxtdvec
Transform the excited state vectors from alpha/beta to spin-adapted ones.
Theoretical Background
Time-dependent DFT (TDDFT) is a powerful tool for studying the electronic structure of molecules and materials. It is a time-dependent extension of density functional theory (DFT), which allows for the calculation of excited states and transition properties.
Input Examples
Example: TDDFT Calculation of HCHO
In this example, we will perform a TDDFT calculation of HCHO at TD-B3LYP/cc-pVTZ level of theory. The input file is as follows:
 1basis
 2    cc-pvtz
 3end
 4
 5scf
 6    charge      0
 7    spin2p1     1
 8    type        R
 9end
10
11mol
12    C -0.000756 -0.520733 0.
13    H  0.935697 -1.111766 0.
14    H -0.939631 -1.107897 0.
15    O  0.001792  0.678123 0
16end
17
18tddft
19    type                   tddft
20    num_states             10
21    max_it                 100
22    dim_trials             50
23    print_coeff_threshold  0.01
24end
25
26task
27    tddft b3lyp
28end
After running the calculation, you will find the following lines:
 1#1: Absolute energy = -114.39668857 Hartree
 2   Excited energy = 4.1600 eV; wavelength = 298.04 nm, oscillator strength = 0.0000
 3   Transition dipole moment (a.u.):  -0.00000  -0.00000  -0.00000
 4   CV(0)    8 -->    9: Coefficient =   -0.9512, Percentage =   99.7 %, IPA =     6.0538 eV
 5#2: Absolute energy = -114.26455102 Hartree
 6   Excited energy = 7.7556 eV; wavelength = 159.86 nm, oscillator strength = 0.0917
 7   Transition dipole moment (a.u.):   0.69575  -0.00144  -0.00000
 8   CV(0)    8 -->   10: Coefficient =    0.9803, Percentage =   99.1 %, IPA =     8.7346 eV
 9#3: Absolute energy = -114.20726662 Hartree
10   Excited energy = 9.3144 eV; wavelength = 133.11 nm, oscillator strength = 0.0004
11   Transition dipole moment (a.u.):   0.00000  -0.00000   0.03936
12   CV(0)    6 -->    9: Coefficient =    0.9615, Percentage =   99.0 %, IPA =    11.0312 eV
You can find excited state energies, oscillator strengths, transition dipole moments, and orbital transition coefficients.
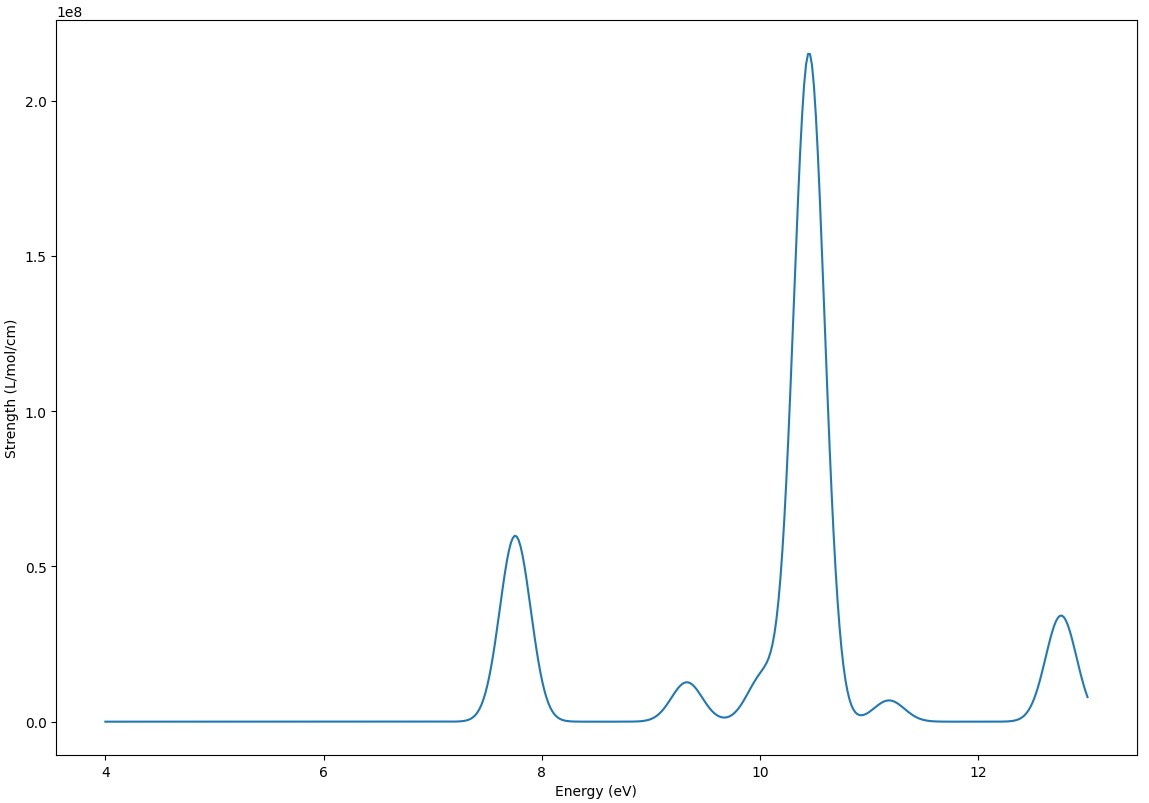
You can also find the spectrum file tddft-1-spectrum.txt.
You can plot the spectrum using a script provided by Qbics, i.e., tools/plotspec.py. Copy this file to the same directory as the input file, and modify the following parameters:
1if __name__ == "__main__":
2    fn = "tddft-1-spectrum.txt"       # Spectrum file name.
3    eL_eV = 4                   # Lower energy limit.
4    eH_eV = 13                  # Higher energy limit.
5    sigma_eV = 0.2              # Sigma value.
6    num_ps = 500                # Number of points.
7    use_angle = False           # Whether to use angle dependence.
8    incident_angles = [i*30 for i in range(4)] # Incident angles.
Line 2: Change the spectrum file name.
Line 3,4: Change the lower and upper energy limit.
Line 5: Change the sigma value.
Line 6: Change the number of points. The larger the number, the smoother the spectrum.
Line 7: Whether to use angle dependence.
Line 8: Incident angles.
Then, you can run the script using the following command:
1$ python plotspec.py
You will find following spectrum plot: